

In Class 10 ICSE (Indian Certificate of Secondary Education) mathematics, Chapter 19 delves into the fascinating world of "Statistics." Statistics is the mathematical discipline that deals with the collection, analysis, interpretation, and presentation of data. This chapter equips students with the tools and knowledge to work with data effectively. Here's an introduction to statistics class 10 ICSE important questions.
In Class 10 ICSE (Indian Certificate of Secondary Education) mathematics, the chapter on "Statistics" is an essential topic that explores the fascinating field of data collection, analysis, interpretation, and presentation. Statistics is a branch of mathematics that helps us make sense of the vast amounts of data we encounter in our lives. Here's an introduction to the topic of statistics in Class 10 ICSE mathematics:
Key Concepts and Objectives:
Data: Data refers to the raw facts, numbers, or information collected from various sources. It can be qualitative or quantitative.
Data Sets: Data sets are collections of data points or observations. They form the basis for statistical analysis.
Data Collection: Statistics involves the methods and techniques for collecting data, whether through surveys, experiments, observations, or research.
Data Organization: To make data more manageable, it is organized using techniques like frequency distribution and histograms.
Measures of Central Tendency: These measures, including the mean (average), median (middle value), and mode (most frequent value), help describe the center or typical value of a data set.
Ans: Statistics is like a magical toolkit that helps you tame and understand data. It's the art and science of working with information, turning it into knowledge, and using that knowledge to make smart decisions. Think of it as your secret weapon for unraveling the mysteries hidden within numbers.
Statistics can be likened to a versatile toolbox that empowers you to decode and make sense of data. It's both an art and a science, where you transform raw information into valuable insights, equipping you to make informed and intelligent choices.
Ans. (a) 21·18
Explanation:
Σf = 10 + 15 + 10 + 8 + 7 + 10 = 60
Σfx = 150 + 270 + 200 + 176 + 175 + 300
= 1271
∴ Mean =\(\frac{\Sigma fx}{\Sigma f}\)=\(\frac{1271}{60}\)=21.18.
Ans. (d) 990 cm2
Explanation:
Radius (r) = \(\frac{1}{2}\)×diameter =\(\frac{21}{2}\) cm
Height (k) = 15 cm
∴ curnel surface area =2πrh
=2×\(\frac{21}{7}\)×\(\frac{21}{2}\)×15
= 990 cm2.
Explanation:
Let the assumed mean A = 70.
Mean =A +\(\frac{\Sigma ft}{\Sigma f}\)× i
=70+ \(\begin{pmatrix} \frac{-593}{1110}\end{pmatrix}\)×20=59.32 ans.
Explanation:
we have
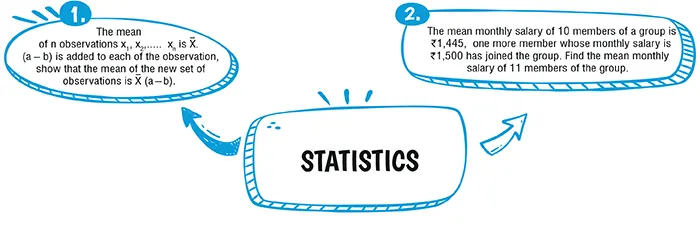
\(\bar{X}\) =\(\frac{x_1+x_2+..+x_n}{n}\).....(i)
Let \(\bar{X}\)= be the mean of x1 + (a,b) x2+(a-b),..., xn+(a-b).Then
\(\bar{X}\)=\(\frac{[x_1+(a-b)]+[x_2(a-b)]+..+[x_n(a-b)]}{n}\)
=\(\frac{x_1+x_2+..+x_n+n(a-b)}{n}\)
=\(\frac{x_1+x_2+..+x_n}{n}\)=\(\frac{n(a-b)}{n}\)
=\(\bar{X}\) +(a−b). [Using (i)]
Explanation:
Here, n=10, \(\bar{X}\)=1445.
So, \(\bar{X}\) = \(\frac{1}{n}\)(∑ x1 )
⇒ n \(\bar{X}\)= ∑ x1
⇒ 10×1445=∑ x1
⇒ ∑ x1=14450.
So, total monthly salary of 10 persons is ₹ 14,450.
Monthly salary of one more person who joined the group is ₹ 1,500.
∴ Total monthly salary of 11 persons
=₹14,450+₹1,500
=₹15,950
So, average monthly salary of 11 persons
=\(\frac{Total\space monthly\space salery}{11}\)
=\(\frac{15,950}{11}\)=₹ 1,450.


In conclusion, the study of statistics in ICSE Class 10 mathematics is a fundamental and empowering journey into the world of data. It equips students with the skills to collect, organize, analyze, interpret, and present information effectively. Statistics is not just about numbers; it's about making informed decisions, solving real-world problems, and understanding the patterns that shape our lives. With a solid foundation in statistics, students are better prepared to navigate the data-rich landscape of the modern world, from academic pursuits to making informed choices in various aspects of life. It's a valuable tool that unlocks a wealth of knowledge and empowers individuals to be data-savvy and informed citizens. For those looking to enhance their grasp of the chapter's content and gain extra practice, oswal.io provides statistics class 10 ICSE important questions that can help foster a more thorough comprehension of the concepts.
Ans: Statistics is used to collect, analyze, and interpret data, enabling us to make informed decisions and draw meaningful conclusions from information.
Ans: Data is raw information or facts collected for analysis. It's crucial in statistics because it forms the basis for drawing conclusions and making predictions.
Ans: Data can be organized using methods like frequency distribution, grouping data into classes, and creating histograms or bar graphs.
Ans: Measures of central tendency, including the mean, median, and mode, help describe the center or typical value of a data set.
Ans: The range is the difference between the maximum and minimum values in a data set. It indicates the spread or variability of the data.


----------------------------------------------------------------------------------------------------------------------------------------------------------------------------------------------------------------
Phone: (+91) 7895987722
Mail: support@oswalpublishers.in
Ground Floor, 1 / 12 Sahitya Kunj, M.G Road
Agra – 282002,Uttar Pradesh (India)
+91-562-25277711/2/3/4 or +91-7455077222
support@oswalpublishers.in
Noida One, B 702, B7, Sector 62, Noida,
Uttar Pradesh 201309
+91-745 507 7222
support@oswalpublishers.in